
"Part 2: Stop Guessing: The Battery Data Stack Installers Actually Need"
- May 1
- 3 min read
Welcome to the second installment of our five-part series on Solar Service. In Part 1, we established why 2025 is the pivotal year to build a service-centric business. Now, we dive into the engine that powers it all: the technology stack. This is your guide to building the digital infrastructure that transforms your service division from a manual effort into a scalable, intelligent, and ultimately autonomous profit machine.

Field Reality: What Customers Send You Is Not Evidence
Support teams don't get neatly labelled datasets. They receive three screenshots taken days apart, with no timestamps, no mode information, no reserve SOC, and no context on what changed in the household that week. And then the customer says: "My battery isn't working."

This is the most expensive kind of support. Everything provided is readable, but almost nothing is interpretable, meaning you can't explain the system's behavior reliably. Installers do not need "more charts." They need a disciplined way to turn telemetry into repeatable triage.
The Central Argument: Readable vs. Interpretable
Telemetry is useful only when it becomes an evidence trail. Your job is not to be a data hoarder; your job is to ensure you can explain behaviour, prove what happened, and isolate root causes fast.
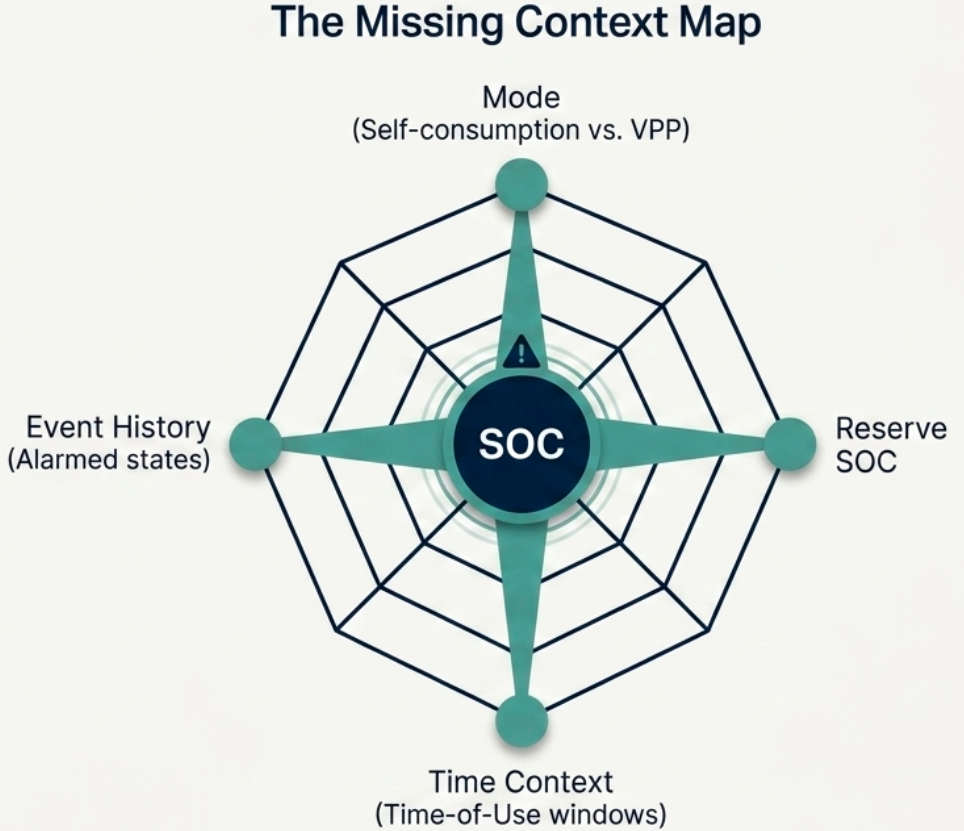
This is vital because controllers and telemetry exposure vary wildly by OEM. Interpretability only comes from pairing basic metrics with deep operational context:
Mode: (Self-consumption vs. time-based vs. backup vs. VPP)
Reserve SOC
Time Context: (Time-of-Use windows)
Event History: (Alarmed or protection states)
Without this context, the most common failure mode for an installer is misdiagnosis.
Stakeholder Lens & Data Boundaries
In a complex system, "missing data" isn't an accident; it's a boundary.
OEM/API Layer: Exposes live power, SOC/SoE, alarms, and sometimes voltage or event logs. If a signal isn't exposed here, you can't "monitor your way" to certainty.
CRM Layer (System of Record): Holds the commissioning evidence pack, circuit map, firmware baseline, tariff notes, and VPP enrolment status.
Customer Layer: Provides timestamps, plan details, and environmental changes (e.g., new heavy loads, Wi-Fi moves).
The Australian context reinforces why structured device records matter. AEMO’s DER Register exists as a foundational database of DER devices across the country, indicating that structured device identity is becoming system-critical.
Readable vs. Interpretable (Be Ruthless)
Don't just say "we need SOC." SOC is readable almost everywhere, but interpretable almost nowhere without context. Here is the strict mapping installers must adopt:

SOH Nuance: What You Cannot Infer Responsibly
Here is the most important professional integrity rule: Do not become a health-score fortune teller.
You cannot responsibly infer definitive degradation from basic vendor dashboards because definitions of "health" vary across OEMs, calibration cycles skew displayed values, and warranties are triggered by specific throughput conditions, not a generic "health score."
When to refuse inference:
When the metric definition is unclear or unexposed.
When the customer demands a warranty guarantee from a single app "score."
Instead: Focus on operational integrity and build an evidence archive (change logs, event history) to prevent misdiagnosis risk.
The Installer Battery Data Stack (Levels 0–3)
Level 0 — Commissioning Baseline: Not optional. CT orientation proof, phase mapping, reserve SOC, comms path test, firmware versions, and tariff notes.

Level 1 — Operational Layer: Real-time "What is it doing?" Tracking SOC/SoE, battery power, grid flows, mode, and schedule with timestamps.

Level 2 — Diagnostics Layer: "Why did it do that?" Tracking comms heartbeats, alarms, temperatures, firmware upgrades, and voltage-sensitive protection triggers.
Level 3 — Evidence Archive: "Prove it." Structured logs of configuration changes, baseline snapshots, and DER system identity.
If you operate on dashboards, you'll get more screenshots and escalation. If you operate on evidence, you get faster answers, fewer truck rolls, and a defensible service posture.

Navigating the solar market requires the right tools and insights. SolYield Software empowers solar professionals to automate operations, maximise customer satisfaction, and grow their business profitably with confidence. If you’d like to learn more or schedule a demo, contact us @ info@solyield.com


Comments